What is buffer capacity?
Buffer capacity is the quantitative measure of a solution’s resistance to pH change—defined as β = dB/dpH, the moles of strong acid or base per liter required to shift pH by one unit (units: mol·L⁻¹·pH⁻¹). It is maximal when pH ≈ pKa of the buffering pair and, for a monoprotic buffer of total concentration C = [HA]+[A⁻], can be calculated at a given temperature (e.g., 25 °C) with the Van Slyke form: β ≈ 2.303·C·(Ka·[H⁺])/(Ka+[H⁺])² (optionally add the water term β_water = 2.303·([H⁺]+Kw/[H⁺])), giving the practical rule β_max ≈ 0.576·C at pH = pKa (names: Henderson–Hasselbalch; Van Slyke). In practice, capacity tells you when a buffer will hold steady (near its pKa), where it’s reliable (bioreactors, pharmaceutical formulations, food fermentation, environmental/water treatment), how to size it (choose pKa near target pH and raise C), and why processes drift if diluted or heated/cooled (β ∝ C; pKa and activities shift with temperature and ionic strength); for example, a 0.10 M acetate buffer at pH ≈ pKa = 4.76 has β_max ≈ 0.0576 mol·L⁻¹·pH⁻¹.
What is the formal definition of buffer capacity?
Buffer capacity (β) is formally defined (Van Slyke) as β = dB/dpH, the differential moles of strong base (or acid) per liter required to change the pH by one unit (units: mol·L⁻¹·pH⁻¹); equivalently, βₐ = dA/dpH for acid additions and β_b = dB/dpH for base additions, reported as a positive magnitude.
For a monoprotic buffer of total concentration C = [HA] + [A⁻] at temperature T, the operational form is β_buffer = 2.303·C·(Kₐ·[H⁺])/(Kₐ + [H⁺])², with β_total = β_buffer + β_water and β_water = 2.303·([H⁺] + K_w/[H⁺]); the maximum occurs at pH = pKₐ with β_max ≈ (2.303/4)·C ≈ 0.576·C (e.g., C = 0.10 M ⇒ β_max ≈ 0.0576 mol·L⁻¹·pH⁻¹).
How does buffer capacity work?
Buffer capacity works by using a weak acid/conjugate base pair to consume added H⁺ or OH⁻ through the reversible reactions A⁻ + H⁺ ⇌ HA and HA + OH⁻ → A⁻ + H₂O, keeping the [A⁻]/[HA] ratio (and thus pH via Henderson–Hasselbalch: pH = pKa + log([A⁻]/[HA])) relatively stable. It is quantified as β = dB/dpH (Van Slyke)—the moles of strong base (or acid) per liter needed to change pH by 1 unit (units: mol·L⁻¹·pH⁻¹)—and for a monoprotic buffer of total concentration C = [HA]+[A⁻] at a given temperature is well-approximated by β ≈ 2.303·C·(Ka·[H⁺])/(Ka+[H⁺])², peaking at pH = pKa with β_max ≈ 0.576·C (e.g., C = 0.10 M ⇒ β_max ≈ 0.0576 mol·L⁻¹·pH⁻¹). Practically, that means a 0.10 M buffer run at pH ≈ pKa in 100 mL would require about 0.576 mmol of strong acid or base to shift pH by 0.10 (Δn ≈ β·V·ΔpH), illustrating how capacity scales with concentration (C) and with proximity to pKa.
Acid vs. Base Buffer Capacity
We compare acid vs. base buffer capacity to size buffers correctly for real loads: you need to know not only the instantaneous resistance to pH change (the differential capacity β = dB/dpH, Van Slyke) but also which side—acid shocks (H⁺) or base shocks (OH⁻)—your recipe can absorb more of, given its [A⁻]/[HA] ratio, total concentration C, and how far the working pH sits from pKₐ.
| Dimension / Term | Acid Buffer Capacity (against added H+) | Base Buffer Capacity (against added OH−) | Notes / Values |
| Differential definition | βa = dA/dpH (mol·L−1·pH−1) | βb = dB/dpH (mol·L−1·pH−1) | Report β as a positive magnitude; units mol·L−1·pH−1. |
| Core theory (monoprotic) | Instantaneous capacity at a given pH is the same in both directions: β ≈ 2.303 · C · (Ka[H+]) / (Ka + [H+])2 | Van Slyke form; add βwater at extremes. | |
| Maximum capacity point | Max at pH = pKa | Max at pH = pKa | βmax ≈ (2.303/4)·C ≈ 0.576·C. Example: C = 0.10 M ⇒ βmax ≈ 0.0576 mol·L−1·pH−1. |
| Directional “reserve” (finite shock tolerance) | Acid reserve ≈ n(A−) available: A− + H+ → HA | Base reserve ≈ n(HA) available: HA + OH− → A− + H2O | Even if β is equal, reserves differ unless [A−] = [HA]. |
| Effect of ratio [A−]/[HA] | If [A−] > [HA], acid reserve is larger | If [HA] > [A−], base reserve is larger | At pH = pKa (1:1), reserves are equal. |
Worked example (1.0 L, C = 0.10 M, pH = pKa + 0.5) | [A−]/[HA] = 100.5 ≈ 3.16 ⇒ [A−] ≈ 0.0759 M ⇒ acid reserve ≈ 75.9 mmol | [HA] ≈ 0.0241 M ⇒ base reserve ≈ 24.1 mmol | Same β at that pH, but ≈3× more H+ can be absorbed before depletion. |
| Concentration dependence | β and reserves increase linearly with C | β and reserves increase linearly with C | 10× concentration ⇒ ~10× capacity. |
| Distance from pKa | Far from pKa, β falls; asymmetry grows if [A−] ≫ [HA] | Far from pKa, β falls; asymmetry grows if [HA] ≫ [A−] | Operate within ±1 pH unit of pKa for strong, balanced capacity. |
| Temperature & ionic strength | pKa(T) and activity changes shift β and reserves | Example: Tris ≈ −0.028 pH·°C−1 (warmer → lower pH at fixed ratio). | |
| Water term (extremes) | At low pH, βwater = 2.303·([H+] + Kw/[H+]) becomes non-negligible | At high pH, βwater similarly contributes | Matters at ≲ pH 3 or ≳ pH 11. |

What is the theory of buffer capacity?
Buffer capacity theory quantifies a solution’s resistance to pH change via the Van Slyke definition β = dB/dpH (mol·L⁻¹·pH⁻¹), coupled with Henderson–Hasselbalch (pH = pKₐ + log([A⁻]/[HA])) to relate pH to composition; for a monoprotic buffer of total concentration C = [HA]+[A⁻], β ≈ 2.303·C·(Kₐ·[H⁺])/(Kₐ+[H⁺])², with a water contribution β_water = 2.303·([H⁺] + K_w/[H⁺]) becoming relevant at very low/high pH.
It predicts a maximum at pH = pKₐ with β_max ≈ (2.303/4)·C ≈ 0.576·C (e.g., C = 0.10 M ⇒ β_max ≈ 0.0576 mol·L⁻¹·pH⁻¹), and shows that capacity scales with C, depends on the [A⁻]/[HA] ratio, and is modulated by temperature (pKₐ(T), e.g., Tris ≈ −0.028 pH·°C⁻¹) and ionic strength/activity effects.
Henderson-Hasselbalch equation
The Henderson–Hasselbalch equation relates pH to buffer composition for a weak acid HA ⇌ H⁺ + A⁻: pH = pKa + log10([A-]/[HA]); for a weak base B ⇌ BH⁺ it can be written as pH = pKa(BH⁺) + log10([B]/[BH⁺]) = pKw − pKb + log10([B]/[BH⁺]) (at 25 °C, pKw ≈ 14.00). It’s a concentration (ideally activity) relationship that turns equilibrium chemistry into a simple, usable formula.
In practice it’s the backbone of buffer design and recipe math: pick a conjugate pair with pKa ≈ target pH, set the [base]/[acid] ratio to hit the setpoint, and predict how composition shifts during titrations; clinically, a specialized form models the blood bicarbonate system: pH = 6.1 + log10([HCO3-]/(α·pCO2)) with α ≈ 0.030–0.031 mmol·L⁻¹·mmHg⁻¹ at 37 °C.
Historically, Lawrence J. Henderson (1908) described the bicarbonate buffer mathematically, and Karl A. Hasselbalch (1916) recast Henderson’s relation onto Sørensen’s pH scale using base-10 logarithms, yielding the compact form used across physiology, biochemistry, and analytical chemistry today.
The equation follows directly from mass action: Ka = [H+][A-]/[HA] → [H+] = Ka·([HA]/[A-]) and taking −log10 gives pH = pKa + log10([A-]/[HA]); this assumes one dominant acid–base equilibrium in the working range and that activities approximate concentrations (γ ≈ 1) unless activity corrections are applied.
To use it, choose a buffer pair with |pH − pKa| ≤ 1, compute the needed ratio from [A-]/[HA] = 10^(pH − pKa), and then select a total concentration C = [A-] + [HA] that meets capacity needs (capacity scales with C); finally convert concentrations to masses/volumes using molar masses or stock solution strengths.
For example, an acetate buffer with pKa = 4.76 and desired [A-]/[HA] = 2.00 gives pH = 4.76 + log10(2) ≈ 5.06; for Tris at pH 8.20 with pKa 8.06, the required ratio is [B]/[BH+] = 10^(0.14) ≈ 1.38, which you scale by your chosen total concentration to meet buffer capacity targets.
Accuracy is typically ~0.1–0.2 pH units under moderate ionic strength, 0.1 ≤ [A-]/[HA] ≤ 10, and known temperature, but errors grow with high ionic strength (activities ≠ concentrations), overlapping equilibria (polyprotic systems outside a single-pKa region), extremes of pH (water autoionization matters), gas exchange (e.g., open CO₂ systems), and complexation/precipitation; use activity coefficients and temperature-correct pKa(T) (e.g., Tris slope ≈ −0.028 pH·°C⁻¹) when needed.
Combined with Van Slyke’s definition of buffer capacity β = dB/dpH (mol·L⁻¹·pH⁻¹), the equation links composition to resistance against pH change: for a monoprotic buffer β ≈ 2.303·C·(Ka·[H+])/(Ka + [H+])², peaking at pH = pKa with β_max ≈ (2.303/4)·C ≈ 0.576·C, so capacity is maximized at the setpoint where [A-] and [HA] are equal.
Common pitfalls include matching the pH but running too low C (weak capacity), ignoring temperature and ionic strength (shifts in apparent pKa), and using CO₂-dependent systems (bicarbonate) in open air; the fixes are to raise C to increase capacity, calibrate and correct pKa(T)/activities, and pick CO₂-independent buffers (e.g., HEPES/MOPS) when gas control isn’t possible.
Van Slyke equation (monoprotic buffer)
The Van Slyke equation quantifies how strongly a buffer resists pH change by defining buffer capacity as β = dB/dpH (moles of strong base—or acid—per liter needed to shift pH by one unit; units mol·L⁻¹·pH⁻¹). For a monoprotic buffer with total concentration C = [HA] + [A⁻] at temperature T, the buffer contribution is β_buffer ≈ 2.303·C·(Ka·[H+])/(Ka + [H+])², and the total capacity at very low/high pH includes water’s autoionization term: β_total = β_buffer + β_water with β_water = 2.303·([H+] + Kw/[H+]) (at 25 °C, Kw ≈ 1.0×10⁻¹⁴).
In practice, this equation tells you where a buffer is strongest (near its pKa) and how much acid or base it can absorb before the pH moves appreciably; the maximum occurs at pH = pKa with β_max ≈ (2.303/4)·C ≈ 0.576·C. That simple rule lets you size real systems: a 0.10 M monoprotic buffer operated at pH ≈ pKa has β_max ≈ 0.0576 mol·L⁻¹·pH⁻¹, so in 100 mL the product β·V ≈ 0.00576 mol·pH⁻¹ and an addition of 0.50 mmol strong acid/base would shift pH by ΔpH ≈ Δn/(β·V) ≈ 0.00050/0.00576 ≈ 0.087.
Historically attributed to Donald D. Van Slyke’s acid–base work in physiology, the equation arises by differentiating the Henderson–Hasselbalch relationship (pH = pKa + log([A⁻]/[HA])) with respect to added strong acid/base under the assumption of a single dominant acid–base equilibrium. It provides the “instantaneous” (differential) capacity at a given pH and composition, which is exactly what you need to predict small pH drifts during titration, dosing, fermentation, or neutralization steps.
To use it, choose a buffer whose pKa sits within about ±1 pH unit of the target, compute [H+] from the working pH, plug Ka and C into β_buffer, and add β_water only when you are near the extremes (≈ pH ≤ 3 or ≥ 11). Then design to a tolerance by rearranging ΔpH ≈ Δn/(β·V): specify the maximum expected acid/base load Δn over a process volume V, solve for the concentration C needed to keep ΔpH within limits, and adjust the [A⁻]/[HA] ratio to run close to pH = pKa for maximum β.
Accuracy depends on how closely activities track concentrations (ionic strength effects) and on temperature, because Ka(T) and Kw(T) shift with T; for example, common buffers like Tris show notable temperature slopes in apparent pH even at fixed composition. The formula is additive across independent equilibria, so polyprotic systems (phosphate, citrate, carbonate) are treated as the sum of “lobes” around each pKa plus the water term, while real-world departures (complexation, precipitation, CO₂ exchange in bicarbonate systems) effectively change C or Ka and should be controlled or modeled.
Henderson–Hasselbalch vs Van Slyke equation
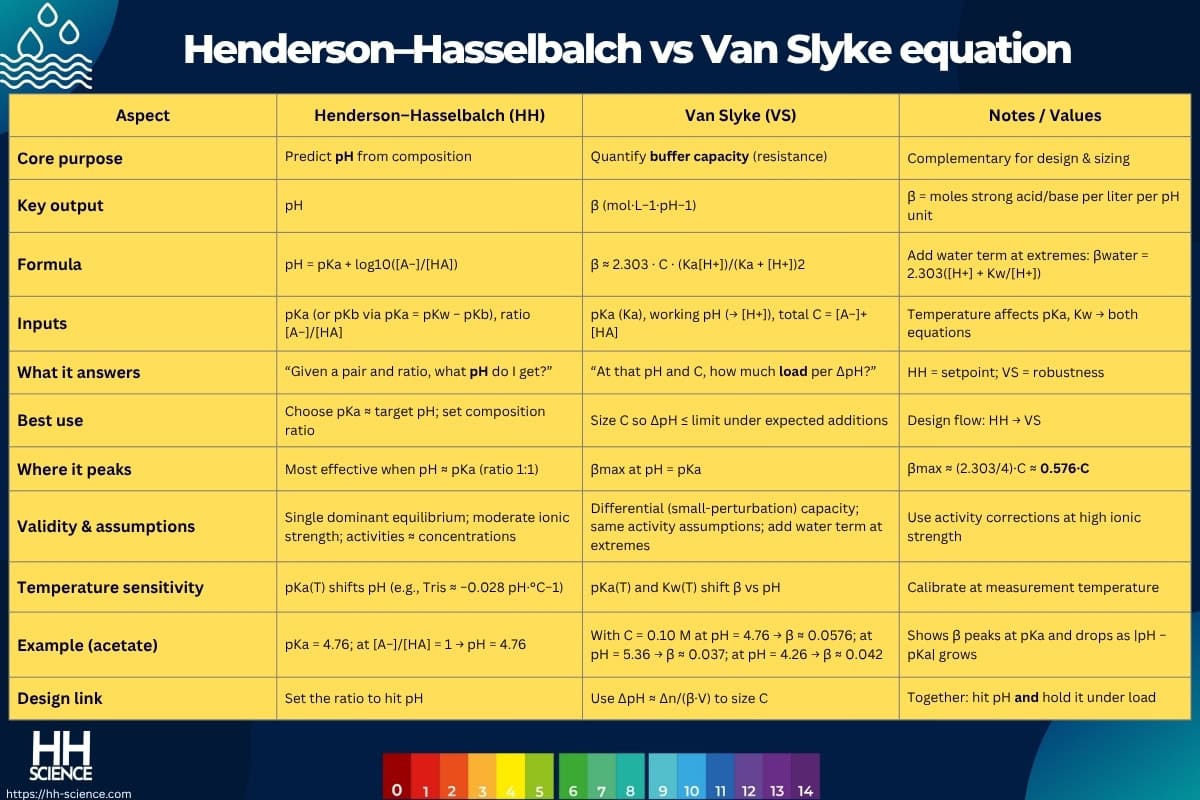
Henderson—Hasselbalch predicts the pH from buffer composition, while Van Slyke quantifies how resistant that pH is to change (buffer capacity β), so comparing them helps you both hit the pH setpoint and size the total concentration C to withstand real acid/base loads at your operating temperature.
| Aspect | Henderson–Hasselbalch (HH) | Van Slyke (VS) | Notes / Values |
| Core purpose | Predict pH from composition | Quantify buffer capacity (resistance) | Complementary for design & sizing |
| Key output | pH | β (mol·L−1·pH−1) | β = moles strong acid/base per liter per pH unit |
| Formula | pH = pKa + log10([A−]/[HA]) | β ≈ 2.303 · C · (Ka[H+])/(Ka + [H+])2 | Add water term at extremes: βwater = 2.303([H+] + Kw/[H+]) |
| Inputs | pKa (or pKb via pKa = pKw − pKb), ratio [A−]/[HA] | pKa (Ka), working pH (→ [H+]), total C = [A−]+[HA] | Temperature affects pKa, Kw → both equations |
| What it answers | “Given a pair and ratio, what pH do I get?” | “At that pH and C, how much load per ΔpH?” | HH = setpoint; VS = robustness |
| Best use | Choose pKa ≈ target pH; set composition ratio | Size C so ΔpH ≤ limit under expected additions | Design flow: HH → VS |
| Where it peaks | Most effective when pH ≈ pKa (ratio 1:1) | βmax at pH = pKa | βmax ≈ (2.303/4)·C ≈ 0.576·C |
| Validity & assumptions | Single dominant equilibrium; moderate ionic strength; activities ≈ concentrations | Differential (small-perturbation) capacity; same activity assumptions; add water term at extremes | Use activity corrections at high ionic strength |
| Temperature sensitivity | pKa(T) shifts pH (e.g., Tris ≈ −0.028 pH·°C−1) | pKa(T) and Kw(T) shift β vs pH | Calibrate at measurement temperature |
| Example (acetate) | pKa = 4.76; at [A−]/[HA] = 1 → pH = 4.76 | With C = 0.10 M at pH = 4.76 → β ≈ 0.0576; at pH = 5.36 → β ≈ 0.037; at pH = 4.26 → β ≈ 0.042 | Shows β peaks at pKa and drops as |pH − pKa| grows |
| Design link | Set the ratio to hit pH | Use ΔpH ≈ Δn/(β·V) to size C | Together: hit pH and hold it under load |
Which solution has the greatest buffer capacity?
The greatest buffer capacity is achieved by the solution with the highest total buffer concentration C = [HA] + [A−], operated at pH = pKa (i.e., [A−]:[HA] = 1:1), where βmax ≈ (2.303/4)·C ≈ 0.576·C (mol·L−1·pH−1). Practically, at the same target pH, a 1.0 M buffer has ~10× the capacity of a 0.10 M buffer (βmax ≈ 0.576 vs 0.0576 mol·L−1·pH−1), and among different chemistries the one whose pKa is closest to the operating pH—mixed near 1:1—will have the greater capacity.
What is the maximum buffer capacity of a solution?
The maximum buffer capacity of a solution (Van Slyke) is β_max = (2.303/4)·C ≈ 0.576·C (units: mol·L⁻¹·pH⁻¹), where C = [HA] + [A⁻] and it occurs at pH = pKₐ with [A⁻] = [HA]. The reason is that resistance to pH change peaks when the weak acid and conjugate base are equimolar (the slope of the Henderson–Hasselbalch relation is maximal there); for example, C = 0.10 M ⇒ β_max ≈ 0.0576 mol·L⁻¹·pH⁻¹.
How do you calculate the buffer capacity of a solution?
The buffer capacity (β) of a solution is calculated as β = dB/dpH (units mol·L⁻¹·pH⁻¹) using the Van Slyke expression β ≈ 2.303·C·(Kₐ·[H⁺])/(Kₐ+[H⁺])² for a monoprotic buffer (with C = [HA]+[A⁻] and [H⁺] from the working pH), optionally adding the water term β_water = 2.303·([H⁺] + K_w/[H⁺]) at very low/high pH, recognizing that capacity peaks at pH = pKₐ with β_max ≈ 0.576·C, depends on total concentration and the [A⁻]/[HA] ratio, varies with temperature and ionic strength (pKₐ(T), K_w(T), activities), and links to finite loads by ΔpH ≈ Δn/(β·V) after stoichiometric neutralization.
- Definition & units: β is the differential moles of strong acid/base per liter needed for a 1-unit pH change (mol·L⁻¹·pH⁻¹), so larger β means stronger resistance to pH drift.
- Core formula (Van Slyke): For a monoprotic buffer, β ≈ 2.303·C·(Kₐ·[H⁺])/(Kₐ+[H⁺])², tying capacity to how close the system is to its pKₐ at the chosen pH.
- Water contribution: Add β_water = 2.303·([H⁺] + K_w/[H⁺]) when pH ≲ 3 or pH ≳ 11, because water autoionization then materially affects total capacity.
- Maximum capacity: At pH = pKₐ (i.e., [A⁻] = [HA]), β_max ≈ (2.303/4)·C ≈ 0.576·C, giving a quick sizing rule from total buffer concentration.
- Concentration & ratio: β rises ~linearly with C and is highest when the [A⁻]/[HA] ratio is near 1:1; far from pKₐ (ratios ≪0.1 or ≫10), β diminishes.
- Temperature & ionic strength: pKₐ(T) and K_w(T) shift with temperature and activities deviate from concentrations at higher ionic strength, so use temperature-correct pKₐ and, if needed, activity coefficients.
- Stoichiometry before differential β: For finite additions, first update n(HA) and n(A⁻) by neutralization (HA + OH⁻ → A⁻ + H₂O; A⁻ + H⁺ → HA), then evaluate β at the new pH/composition.
- Design linkage: To meet a tolerance ΔpH under a predicted load Δn in volume V, use ΔpH ≈ Δn/(β·V) (evaluated near the operating pH) to solve for the required C.
- Polyprotic systems: For buffers like phosphate or citrate, total β is the sum of lobe contributions around each pKₐ plus the water term, reflecting multiple equilibria.
How do you determine which solution has the greatest buffer capacity?
You determine it by calculating the buffer capacity β at the intended operating pH with the Van Slyke expression β ≈ 2.303·C·(Kₐ·[H⁺])/(Kₐ+[H⁺])² (add β_water = 2.303·([H⁺] + K_w/[H⁺]) at pH ≲ 3 or ≳ 11) and choosing the solution with the largest β.
You can use the rule of thumb that capacity is greatest at pH ≈ pKₐ with [A⁻] = [HA], giving β_max ≈ (2.303/4)·C ≈ 0.576·C, so at the same pH the higher-concentration buffer (e.g., 1.0 M vs 0.10 M) has ~10× greater capacity.
How do you choose the highest capacity buffer solution?
You choose the highest-capacity buffer by selecting a conjugate pair with pKₐ closest to your target pH (ideally pH ≈ pKₐ), preparing it near equimolar ([A⁻] = [HA]) and at the highest practical total concentration C, because capacity peaks at pH = pKₐ with β_max ≈ (2.303/4)·C ≈ 0.576·C (mol·L⁻¹·pH⁻¹).
You then confirm numerically at the operating pH using the Van Slyke relation β ≈ 2.303·C·(Kₐ·[H⁺])/(Kₐ+[H⁺])² (add β_water at pH ≲ 3 or ≳ 11) and pick the formulation with the largest β—for example, at the same pH a 1.0 M buffer provides ~10× the capacity of a 0.10 M buffer.
What factors determine the capacity of a buffer?
The capacity of a buffer is determined by total concentration (C), the conjugate ratio [A⁻]/[HA] (i.e., proximity to pKₐ), temperature (pKₐ(T), pK_w(T)), ionic strength/activities, solvent composition, gas exchange (e.g., CO₂ in bicarbonate), complexation/precipitation with metals, dilution/evaporation, measurement/system factors (ATC, junctions, calibration), plus polyprotic-equilibria overlap and the water term at very low/high pH—because each of these shifts effective equilibria or activities and thus the differential capacity β = dB/dpH, which peaks at pH = pKₐ and scales ~linearly with C.
- Total concentration (C): Capacity rises ~linearly (β ∝ C); e.g., β_max ≈ 0.576·C so 1.0 M gives ≈10× the β of 0.10 M.
- Ratio [A⁻]/[HA] (proximity to pKₐ): Max at [A⁻]=[HA] (pH≈pKₐ); far from 1:1 the same pH can have much lower β.
- Temperature: pKₐ(T) and pK_w(T) shift with T, changing β; example Tris ≈ −0.028 pH·°C⁻¹ at fixed composition.
- Ionic strength & activities: Higher ionic strength alters activity coefficients (γ), shifting apparent pKₐ and reducing/increasing β.
- Solvent composition: Organic co-solvents change dielectric constant and pKₐ, often lowering β at the same nominal concentrations.
- Gas exchange (CO₂): In bicarbonate systems, pCO₂ fixes the acid partner (H₂CO₃); CO₂ uptake/release changes the ratio and β.
- Complexation/precipitation: Binding or precipitation (e.g., phosphate–Ca²⁺/Mg²⁺, citrate–metal) removes HA/A⁻, effectively lowering C and β.
- Dilution/evaporation: Dilution drops C (β falls) while pH may shift little; evaporation does the opposite and can skew the ratio.
- Measurement/system factors: Poor ATC, junction potentials, or miscalibration distort the apparent pH and the β you compute from it.
- Polyprotic equilibria overlap: Total β is the sum of lobes around each pKₐ; capacity depends on which region you operate in.
- Water term at extremes: At pH ≲ 3 or ≳ 11, β_water = 2.303·([H⁺] + K_w/[H⁺]) becomes significant in β_total = β_buffer + β_water.

What are the effects of dilution & concentration on buffer capacity?
The buffer capacity scales approximately linearly with the total buffer concentration C (β ∝ C), so dilution proportionally decreases β and concentration increases it; at the optimum pH = pKₐ, the Van Slyke relation gives β_max ≈ (2.303/4)·C ≈ 0.576·C (mol·L⁻¹·pH⁻¹), meaning a 10× dilution cuts capacity by ~10× while the pH often changes little if the [A⁻]/[HA] ratio is preserved (minor shifts can arise from ionic-strength/activity changes). The practical impact follows ΔpH ≈ Δn/(β·V): for example, a 0.10 M buffer at pH ≈ pKₐ has β ≈ 0.0576 mol·L⁻¹·pH⁻¹ (so adding 1.0 mmol strong acid to 100 mL gives ΔpH ≈ 0.001/0.00576 ≈ 0.17), whereas 2× dilution to 0.050 M halves β to 0.0288, doubling the drift to ΔpH ≈ 0.35 under the same load.
Comparing the different buffer solutions’ capacity
Here’s a practical comparison under the same conditions so it’s apples-to-apples: assume 25 °C, total buffer concentration C = 0.10 M, and compare capacities at a single operating pH = 7.40 using the Van Slyke form (β ≈ 2.303·C·(Kₐ·[H⁺])/(Kₐ+[H⁺])²; water term negligible near neutral). For reference, the maximum possible capacity at C = 0.10 M is β_max ≈ 0.576·C = 0.0576 mol·L⁻¹·pH⁻¹ when pH = pKₐ.
| Buffer (conjugate pair) | pKa (approx.) | Effective pH range | β at pH 7.40, C = 0.10 M (mol·L−1·pH−1) | vs βmax @ 0.10 M | Notes / Features |
| Phosphate (H2PO4− / HPO42−) | 7.20 | 6.2–8.2 | 0.0546 | 94.8% | Near-neutral workhorse; low cost; can precipitate with Ca2+/Mg2+ |
| HEPES | 7.55 | 6.8–8.2 | 0.0559 | 97.0% | Good’s buffer; CO2-independent; low UV absorbance |
| MOPS | 7.20 | 6.5–7.9 | 0.0546 | 94.8% | Good’s buffer; stable near neutral |
| TES | 7.50 | 6.8–8.2 | 0.0568 | 98.6% | Good’s buffer; alternative to HEPES |
| Tris (B/BH+) | 8.06 | 7.0–9.0 | 0.0339 | 58.9% | Popular in molecular biology; strong temp slope (~−0.028 pH/°C) |
| PIPES | 6.76 | 6.1–7.5 | 0.0349 | 60.6% | Good’s buffer; low metal binding |
| Bicarbonate (H2CO3 / HCO3−) | 6.35 | 5.1–7.1 | 0.0173 | 30.0% | CO2-dependent system (pCO2 control needed) |
| Citrate (multi-pKa; pKa3 ≈ 6.40) | 6.40 | 2.2–6.2 | 0.0190 | 33.0% | Metal chelation; multi-lobe behavior |
| MES | 6.15 | 5.5–6.7 | 0.0116 | 20.2% | Good’s buffer for mildly acidic range |
| Acetate (CH3COOH / CH3COO−) | 4.76 | 3.8–5.8 | 0.000525 | 0.9% | Great acidic buffer, weak near neutral |
| Borate (B(OH)3 / B(OH)4−) | 9.24 | 8.8–10.2 | 0.00323 | 5.6% | Alkaline region; nucleic-acid uses |

Takeaways: capacity at a fixed pH is highest when the buffer’s pKₐ ≈ operating pH and rises with total concentration C; near pH 7.4, phosphate, HEPES, MOPS, and TES cluster close to the theoretical maximum (0.0576), while acidic (acetate/MES) or alkaline (borate) systems show much lower β at the same pH.
Buffer capacity calculator
This calculator computes buffer capacity (β = ΔB/ΔpH, units mol·(chosen volume unit)⁻¹·pH⁻¹) from your entered amount of strong acid/base per volume (ΔB, with automatic unit conversion across mm³, cm³, m³, in³, ft³, mL, L, US/UK gal, US/UK fl oz) and the initial and final pH (ΔpH), instantly returning how many moles per unit volume your solution can absorb per pH unit—a practical gauge of pH robustness that scales ~linearly with total buffer concentration C (e.g., β_max ≈ 0.576·C at pH = pKₐ).
Examples of buffer capacity calculation
Here are classic buffer-capacity examples at 25 °C using the Van Slyke relation β ≈ 2.303·C·(Kₐ·[H⁺])/(Kₐ+[H⁺])² (units mol·L⁻¹·pH⁻¹; add β_water = 2.303·([H⁺]+K_w/[H⁺]) near extremes) and showing the resulting ΔpH ≈ Δn/(β·V) for a 1.00 mmol strong acid/base load in 0.100 L.
| # | Scenario | Buffer / pKa | Conditions | βbuffer (mol·L−1·pH−1) | βwater | βtotal | ΔpH for 1.00 mmol in 0.100 L | Highlight |
| 1 | Max capacity at setpoint | Acetate / 4.76 | C = 0.10 M, pH = pKa = 4.76 | 0.0576 | — | 0.0576 | ≈ 0.174 | βmax ≈ 0.576·C |
| 2 | 1 pH unit above pKa | Acetate / 4.76 | C = 0.10 M, pH = 5.76 | 0.0190 | — | 0.0190 | ≈ 0.525 | About one-third of βmax |
| 3 | Near-neutral workhorse | Phosphate / 7.20 | C = 0.10 M, pH = 7.40 | 0.0546 | — | 0.0546 | ≈ 0.183 | ~95% of βmax at this pH |
| 4 | Good’s buffer near target | HEPES / 7.55 | C = 0.10 M, pH = 7.40 | 0.0559 | — | 0.0559 | ≈ 0.179 | CO2-independent; strong near 7.4 |
| 5 | pKa offset costs capacity | Tris / 8.06 | C = 0.10 M, pH = 7.40 | 0.0339 | — | 0.0339 | ≈ 0.295 | Further from pKa ⇒ lower β |
| 6 | Mildly acidic buffer at 7.4 | MES / 6.15 | C = 0.10 M, pH = 7.40 | 0.0116 | — | 0.0116 | ≈ 0.861 | Not ideal far from pKa |
| 7 | Alkaline buffer used near neutral | Borate / 9.24 | C = 0.10 M, pH = 7.40 | 0.00323 | — | 0.00323 | ≈ 3.091 | Very weak at this pH |
| 8 | Low-pH regime (water term matters) | Acetate / 4.76 | C = 0.10 M, pH = 2.00 | 0.000399 | ≈ 0.0230 | ≈ 0.0234 | ≈ 0.427 | Include βwater at pH ≲ 3 |

Which solution has the greatest buffer capacity?
A buffer formulated at pH = pKₐ and with the highest total concentration C has the greatest buffer capacity because the Van Slyke relation gives β_max = (2.303/4)·C ≈ 0.576·C (mol·L⁻¹·pH⁻¹) when [A⁻] = [HA]. For example, at the same pH an equimolar 1.0 M buffer delivers β_max ≈ 0.576 versus 0.0576 for 0.10 M, i.e., ~10× higher capacity.
Does NaHCO₃ have buffer capacity by itself?
No, NaHCO₃ solution does not have meaningful buffer capacity by itself because a buffer requires comparable amounts of a conjugate acid–base pair, and NaHCO₃ alone supplies mostly HCO₃⁻ but lacks its acid partner H₂CO₃/CO₂(aq) (pKₐ₁ ≈ 6.35) or its base partner CO₃²⁻ (pKₐ₂ ≈ 10.33), so although a plain NaHCO₃(aq) drifts to pH ≈ 8.3 at 25 °C, its β is very low until CO₂ is controlled or Na₂CO₃/CO₂ is added to form a true buffer pair.
Why does dilution decrease capacity but not pH much?
Dilution lowers buffer capacity because ∝ (Van Slyke), so when total concentration C = [HA]+[A⁻] is reduced—e.g., 10× dilution—β_max ≈ 0.576·C drops ~10× (from 0.0576 to 0.00576 mol·L⁻¹·pH⁻¹ for a 0.10→0.010 M buffer at pH = pKₐ). Dilution usually doesn’t change pH much because Henderson–Hasselbalch depends on the ratio [A⁻]/[HA], which remains essentially constant under uniform dilution, with only small shifts from ionic strength/activity changes or CO₂ exchange.
Can buffer capacity be negative?
No, buffer capacity can not be negative because by definition β = dB/dpH (often taken as |ΔB|/|ΔpH|) is the amount of strong acid/base per liter per pH unit, and the Van Slyke form β = 2.303·C·(Kₐ[H⁺])/(Kₐ+[H⁺])² + 2.303·([H⁺] + K_w/[H⁺]) is ≥ 0 for all pH (units: mol·L⁻¹·pH⁻¹). Apparent “negative β” only comes from sign conventions or arithmetic errors (e.g., using −ΔpH or mixing dA/dpH with acid additions), while physically reported capacities are positive magnitudes—for example, at pH = pKₐ with C = 0.10 M, β_max ≈ 0.0576.
How close to pkₐ should I run for maximum β?
Run at pH = pKₐ—ideally within ±0.1–0.2 pH units—for maximum buffer capacity, because the Van Slyke relation β = 2.303·C·(Kₐ·[H⁺])/(Kₐ+[H⁺])² peaks when [A⁻] = [HA], giving β_max ≈ (2.303/4)·C ≈ 0.576·C (mol·L⁻¹·pH⁻¹). At fixed C, staying near pKₐ preserves capacity: ~99% at ±0.1, ~95% at ±0.2, ~89% at ±0.3, ~73% at ±0.5, and only ~33% at ±1.0 pH unit from pKₐ.
Does a buffer with more solution have a greater buffer capacity?
No, a buffer with more solution does not have a greater buffer capacity because β = dB/dpH is an intensive property set by total concentration C and proximity to pKₐ (with β_max ≈ 0.576·C), not by volume—though the total buffering ability of the whole sample scales with β·V.
Does NaHCO3 solution have buffer capacity?
No, NaHCO₃ solution does not have meaningful buffer capacity by itself because a buffer needs a conjugate acid–base pair and plain NaHCO₃ provides mostly HCO₃⁻ without its acid partner H₂CO₃/CO₂(aq) or base partner CO₃²⁻, so substantial β appears only when CO₂ is controlled (pKₐ₁ ≈ 6.35) or carbonate is present (pKₐ₂ ≈ 10.33).
Why does dilution decrease buffer capacity increase as the solution?
Dilution decreases buffer capacity because β (buffer capacity per liter) is proportional to the total buffer concentration C—formally β ≈ 2.303·C·(Kₐ[H⁺])/(Kₐ+[H⁺])² and at the optimum β_max ≈ 0.576·C—so adding solvent lowers C and thus β, even though the volume increases. In fact, if you simply double the volume with water (0.10 M → 0.050 M), β halves (0.0576 → 0.0288 mol·L⁻¹·pH⁻¹) but the total buffering ability of the whole sample (β·V) stays about the same (0.0576×0.100 = 0.0288×0.200 = 0.00576 mol·pH⁻¹), with small real-world shifts from ionic-strength and CO₂ effects.


